Invidious
Log in

3:19

Plot Multiple Lines in Excel | How to graph Multiple lines in 1 Excel plot | line chart in excel

Teaching Junction

Shared 2 years ago

265K views

15:12

Quick 3D Container Chart in Excel

PK: An Excel Expert  

Shared 3 years ago

145K views

6:37

How to create a Gantt Chart in Excel

Ajay Anand  

Shared 3 years ago

202K views

3:45

How to Create Charts in Microsoft Excel | Pie Chart in Excel | Line Chart in MS Excel

StudySpan  

Shared 4 years ago

666K views

6:44

Doughnut Chart for Excel Dashboards: Simple and Easy way! [Excel Free Template]

SD Motion

Shared 5 years ago

74K views

3:25

How to Adjust Line Width in Excel Line Graph

Teaching Junction

Shared 3 years ago

16K views

3:05

How to Create In-Cell Bar Chart in Microsoft Excel | Charts in Excel

StudySpan  

Shared 11 months ago

9.7K views

14:56

Excel Speedometer Chart | Gauge Chart | Excel in Life | | Graph | Progress Chart | Dashboard

Excel in Life

Shared 4 years ago

4.3K views

5:27

Excel Visualization | How To Combine Clustered and Stacked Bar Charts

Jie Jenn

Shared 4 years ago

187K views

2:30

Excel Pro Trick: Make Top 5 Ranking Chart in Excel Show Top N values with position number in Excel

Learn Excel to excel

Shared 3 years ago

15K views

0:43

Excel create bar chart with trend lines | 30 seconds

Quick tips

Shared 4 years ago

44K views

25:49

10 Pro Tips for Excel Charts

PK: An Excel Expert  

Shared 5 years ago

33K views

6:18

Profit and Loss Chart in Excel | Step by Step tutorial

PK: An Excel Expert  

Shared 1 year ago

8.2K views

3:08

How to add solid line on vertical axis (y-axis) in excel charts (bar and line graph)

Teaching Junction

Shared 2 years ago

4.5K views

36:16

How to Create Dynamic Target vs Actual Chart in Excel | Excel Data Visualization Tutorial

Satish Dhawale

Shared 10 months ago

16K views

10:50

How to create a secondary axis in Excel charts

Teaching Junction

Shared 5 years ago

79K views

26:38

Best 15 Excel Charts for Perfect Data Visualization

Office Tech Skill

Shared 1 year ago

1.9K views

11:21

How to create a 4-Quadrant Matrix Chart in Excel

Teaching Junction

Shared 2 years ago

1.3K views

6:04

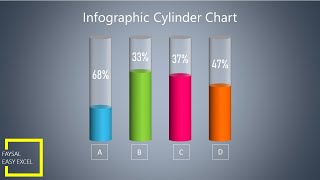
Infographic Cylinder Chart in Excel 2016 | Beautiful Excel Charts Templates | Design Charts in Excel

Faysal Easy Excel

Shared 3 years ago

1.5K views

12:15

Quick 3D Container Chart in Excel | Cylinder Chart in Excel

Unofficial Karyalay

Shared 2 years ago

998 views

6:16

Target Chart in Excel with Over - Under Achievement (step by step guide)

Biz Infograph

Shared 6 years ago

22K views

4:17

How to Add Data Series to a Chart in Excel (Line Graph or Line Chart)

Teaching Junction

Shared 3 months ago

826 views

3:25

How to Create a Combo Chart in Microsoft Excel | Charts in Excel

StudySpan  

Shared 5 months ago

4.9K views

Source code Documentation
Released under the AGPLv3 on GitHub. View JavaScript license information. View privacy policy.
Donate Current version: 2026.02.07-118d635 @ (HEAD detached at v2.20260207.0) ( v2.20260207.0 )